
Microsoft Teams: the blind spot in your observability strategy
IT teams face it every single day: Microsoft Teams has become the backbone of enterprise collaboration. By 2024, the platform reached 320 million monthly active users continuing the steady growth that began during the pandemic.
But mass adoption comes with an unexpected side effect: a surge in support tickets. Choppy audio, frozen video, screen sharing failures… yet in Microsoft’s Admin Center, every indicator stays green.
The result:
- unhappy users,
- overwhelmed helpdesks,
- managers questioning tool reliability,
- network teams struggling with no actionable data,
- and all too often, equipment renewal policies (headsets, laptops, routers) rolled out without ever identifying the true root cause.
This paradox reveals something deeper: traditional monitoring tools don’t cover the specificities of Teams, leaving IT teams blind when it comes to diagnosing call and meeting issues.
Why users complain (even when everything looks “green”)
Growing IT ticket volumes for teams incidents
On the ground, IT teams report a sharp increase in Level 1 tickets related to Teams:
- “I couldn’t hear my counterpart during the meeting.”
- “Screen sharing is lagging is it the VPN?”
- “Teams disconnected in the middle of my client presentation.”
- “Where did my Teams communication go?”
These tickets share a painful trait: they’re time-consuming and hard to resolve.
According to Gartner, the average resolution time for a collaboration incident exceeds two hours. Without precise technical visibility, helpdesks are forced into trial-and-error troubleshooting, wasting time and frustrating users.
When standard tools hit their limits
Microsoft’s Call Quality Dashboard (CQD) is the official reference for Teams monitoring. It provides useful aggregated metrics on call quality but with major limitations in enterprise environments.
CQD Strengths:
- Overall view of quality trends
- Standardized metrics
- Native integration into the Microsoft ecosystem
CQD Limitations in practice:
- No real-time diagnostics: data is delayed by at least 30 minutes.
- No site/network correlation: no way to link call quality with local infrastructure.
- Incomplete telemetry when a network cut occurs.
If your Madrid branch suffers latency issues degrading calls, CQD won’t clearly show you.
The network problem: 60% of Teams incidents originate locally
The missing “Site Dimension” in monitoring
Research by Zscaler reveals that over 60% of Teams degradations come from local network issues: congested WiFi, faulty routers, insufficient bandwidth, or overloaded VPNs.
This ground reality clashes with centralized monitoring approaches, which aggregate metrics without geographic granularity.

Typical use case: the impossible diagnosis
Scenario: A salesperson traveling to Lyon reports inaudible calls during a key client presentation.
Traditional troubleshooting:
- Check CQD → No global anomaly.
- Test user connection → Bandwidth looks fine.
- Check equipment → Headset and mic working.
- Escalate to Level 2 → Deeper network investigation.
- After 2h15: Discover the office WiFi router was failing.
Resolution time: Over two hours for a basic issue simply because site-level visibility was missing.
DEX Tools: Useful but Not Enough for Teams
The Digital Employee Experience (DEX) Approach
DEX solutions like Nexthink or Aternity deliver valuable insights into overall employee experience. They excel at monitoring general performance (boot times, CPU usage, app health).
DEX Strengths:
- Holistic view of the digital experience
- Correlation between device performance and user feedback
- Unified dashboard for all apps
But for Teams specifically:
- No codec-level analysis (audio/video specifics)
- Generic network metrics, not tailored to VoIP
- No correlation between perceived quality and Teams technical metrics
The need for a hybrid approach
The pragmatic way forward is not to replace DEX but to complement it with Teams-specific observability.
This strategy enables organizations to:
- Keep existing DEX investments,
- Fill the blind spot in unified communications,
- Provide network teams with actionable data.
ℹ️ Did you know?
Observability means understanding a complex system’s behavior through its internal signals (logs, metrics, traces).
- Monitoring says: “It works / it doesn’t work.”
- Observability says: “Here’s why it doesn’t work, and where to act.”
In the case of Microsoft Teams, it’s the difference between knowing a call failed and knowing within 3 minutes whether it was caused by WiFi, VPN, a local site, or Microsoft’s own services.
Closing the blind spot
The mass adoption of Teams is reshaping IT monitoring requirements. Traditional tools, while useful, no longer suffice to ensure a smooth user experience.
The most mature organizations adopt a three-layer strategy:
- Global monitoring: Microsoft CQD + existing DEX solutions
- Specialized observability: Teams-focused tools with network correlation
- Automation: Automated diagnostics and proactive remediation
This approach reduces resolution times by up to 70% and significantly improves user satisfaction.
The power of observability
With MS Teams Observability you get:
- An interactive site map showing Network Performance Assessment compliance.
- A dedicated network view (compliance distribution, call quality, root causes, call volumes).
- Detailed per-call analysis, mapping streams, identifying impacted users, and displaying all relevant metrics.

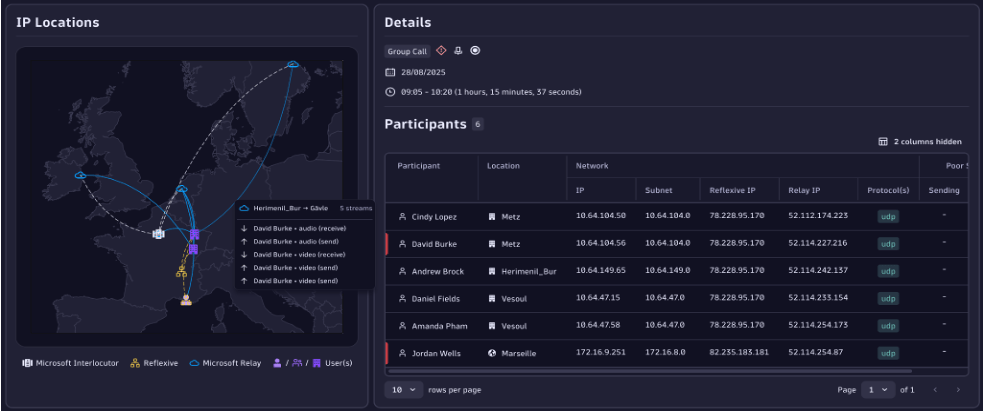

Visualize, diagnose and act in 3 minutes
Thanks to the waterfall method, enhanced by AI Copilot, every call can be replayed as a timeline:
- Who was connected,
- From which network,
- With what audio/video stream quality.
The result: root cause analysis in under 3 minutes.

Use Cases
- Helpdesk: fewer escalations, more Level 1 tickets resolved.
- Managers: improved employee experience, fewer wasted meetings.
- NOC/Network teams: clear KPIs to prioritize corrective actions.
- IT leadership: stronger control of Teams adoption and license optimization.
Practical tips for IT teams
- Helpdesk teams: Train them to read the waterfall timeline and close tickets without escalation.
- Network/NOC teams: Configure site-level alerts (latency, packet loss) and audit all sites in one click before users complain.
- Managers: Track Teams adoption KPIs (usage by department, perceived quality) to measure productivity impact.
- CIO/IT leaders: Integrate Teams Observability into your stack (Dynatrace, Splunk) to unify visibility and cut costs from monolithic DEX tools.

Conclusion: Teams Observability the missing piece in collaborative monitoring
Existing tools (CQD, Nexthink, Aternity) provide part of the picture but leave a critical blind spot: site-level and network visibility.
With MS Teams Observability, you gain faster diagnostics, operational efficiency, and improved employee experience.
In a world where Teams is as vital as email or telephony, not observing Teams is a major risk. Cut your resolution times and boost your users’ Teams experience. Discover MS Teams Observability by Phenisys.
FAQ – Microsoft Teams Observability
1. How do I diagnose a Microsoft Teams call issue?
The most effective way is with a dedicated observability solution. Unlike simple monitoring, it lets you replay the call as a waterfall timeline, analyze each stream (audio, video, screen-sharing), and identify the root cause in minutes: local network, VPN, WiFi, latency, or a Microsoft outage.
2. Why isn’t Microsoft’s call quality dashboard (CQD) enough?
CQD provides useful aggregate stats, but has key limits:
- No fine-grained site-by-site visibility
- No real-time diagnostics
- No clear link between metrics and user experience
👉 For IT teams, this means endless tickets without quick answers.