New in Teams Telephony: near real-time call metrology with Microsoft Teams Observability by Phenisys
Microsoft Teams has become the backbone of enterprise communication – for meetings, collaboration, and now full-fledged corporate telephony. But when it comes to call quality, performance metrics, and troubleshooting, most organizations still face the same problem: no clear visibility.
That’s exactly what Phenisys is solving with the latest update to Microsoft Teams Observability – introducing a brand-new Telephony Metrology experience, designed for near real-time visibility and end-to-end troubleshooting of Teams calls.

Why Teams Telephony Metrology Matters More Than Ever
With thousands of enterprises moving their telephony to Microsoft 365 – via Direct Routing or Calling Plans – monitoring Teams Telephony performance has become a strategic IT challenge.
Without proper metrology, IT teams struggle to:
- Identify the root cause of degraded calls,
- Correlate network and user performance,
- Track adoption and license usage,
- Understand whether an issue comes from Microsoft, the network, or the endpoint.
Native tools like Call Quality Dashboard or the Teams Admin Center often fall short. They’re slow, admin-only, and lack the ability to correlate multiple data sources.
That’s where Phenisys comes in.


Beyond Native Monitoring: Introducing True Observability for Teams Telephony
Phenisys’ Microsoft Teams Observability app brings a completely new experience to telephony troubleshooting natively integrated with your observability stack (Dynatrace, Splunk, and more).
The solution leverages Microsoft APIs and Phenisys’ observability expertise to deliver live, actionable insights into Teams usage and performance.
With the new Users page, Phenisys introduces a faster, sharper way to explore telephony data.
The New “Users” Page: Faster Inventory, Sharper Filtering, Seamless Investigation
Live inventory of Teams call participants
At a glance, access a live inventory of every user who placed a call during your selected timeframe. No complex queries, no delays : just real data, updated in near real-time.
Fast and precise filtering
Use the filter bar to narrow down results instantly. Filter by user, site, subnet, network, or quality metrics and zero in on the issue in seconds.
Expand for context and correlation
Need to dig deeper? Expand any participant to see detailed call records, performance metrics (latency, jitter, MOS), devices, and correlated Microsoft data sources, including PSTN Logs and Direct Routing traces.
Follow the trail end-to-end
Ready to investigate further? Jump directly to the Calls page with that participant already applied maintaining full context and saving precious time during triage.
In short: the new Users page delivers faster inventory, sharper filtering, and seamless investigation, engineered for enterprise-grade troubleshooting.
Smart Telephony Insights: Designed for IT, Ops, and Helpdesk
Every persona in your IT organization benefits from this new metrology layer:
- Helpdesk / Level 1 support – Quickly determine if an incident originates from the user’s device, network, or Microsoft service.
- Operations & Network teams – Identify problem sites using geo-mapped analytics and subnet-level KPIs.
- Management – Track adoption, monitor SLA trends, and drive continuous improvement.
- AI-ready analysis – The app is built for next-generation capabilities with Copilot integration, enabling “1-click to Root Cause” analysis.


Monitoring Call Queues and Auto Attendants
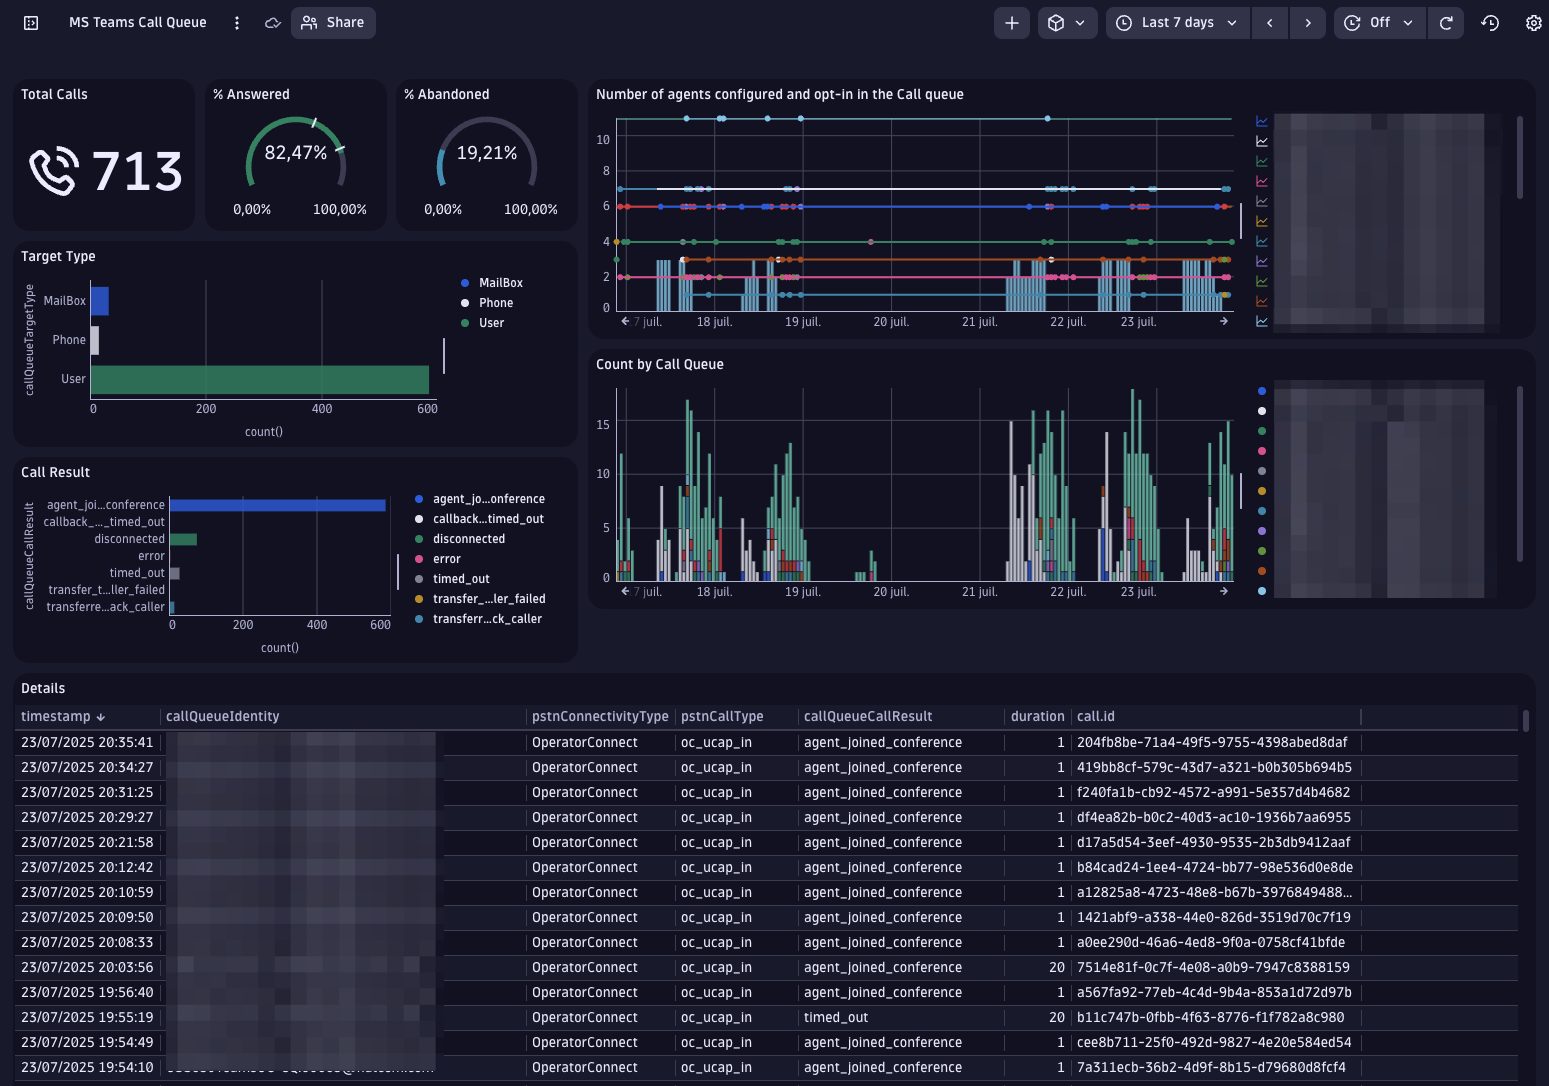
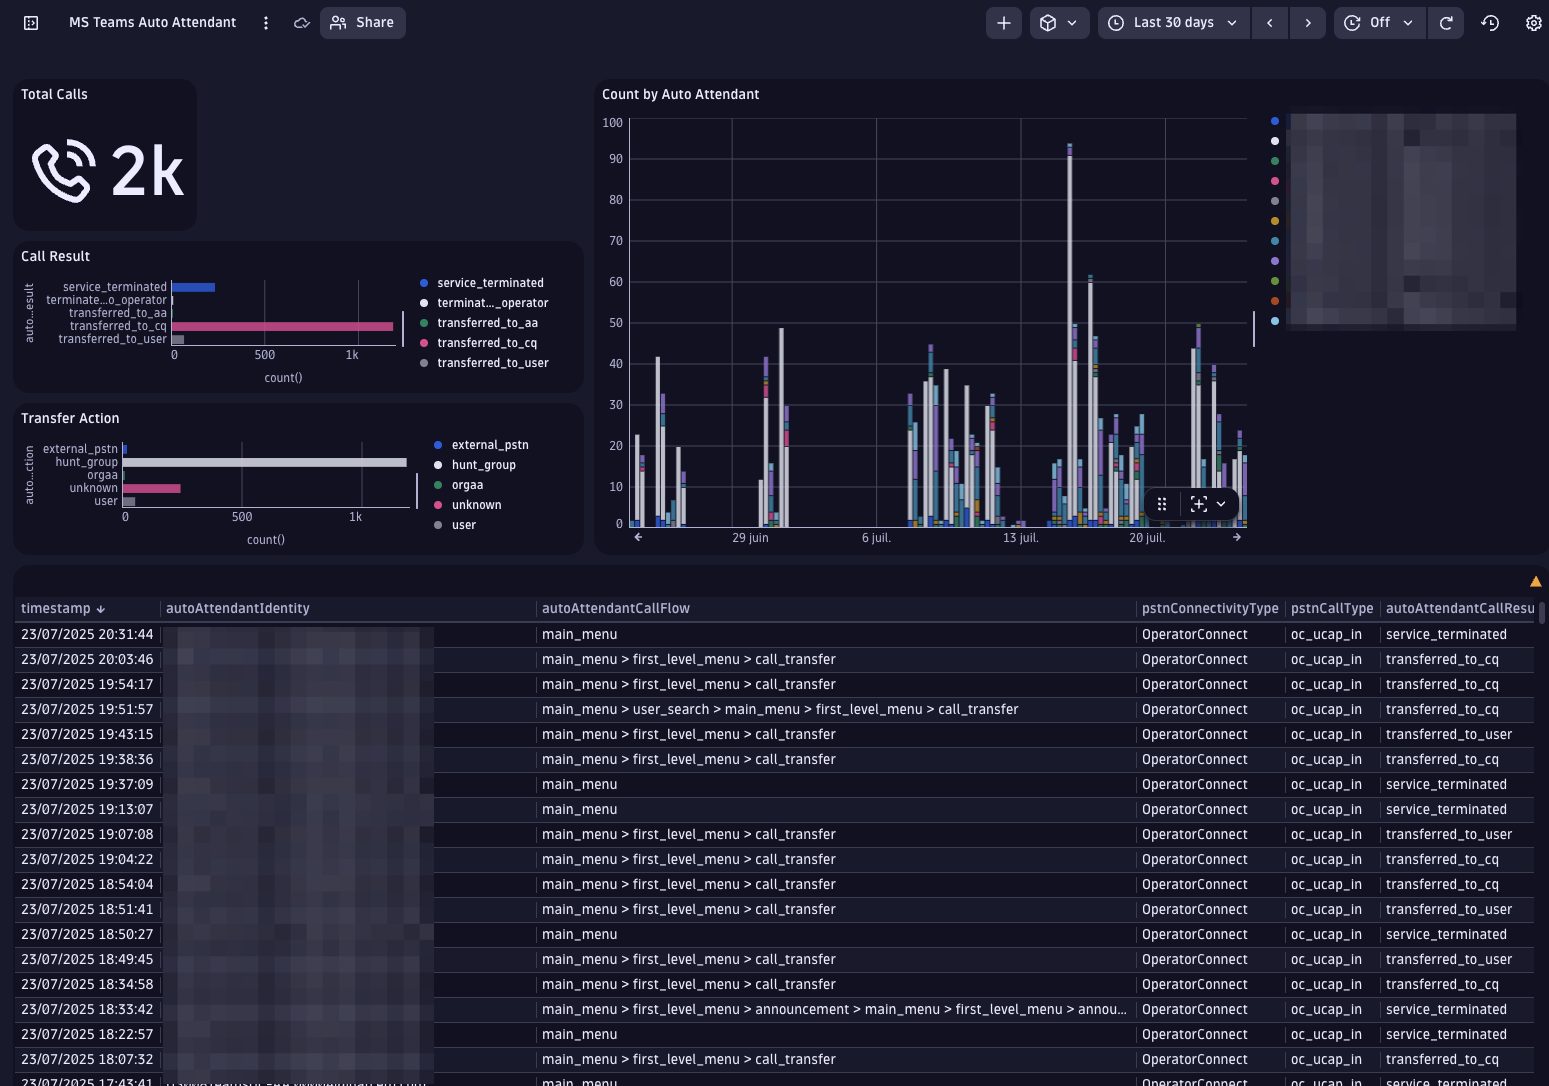
Beyond individual user calls, Microsoft Teams Observability by Phenisys also provides deep visibility into Call Queues and Auto Attendant flows.
By leveraging Microsoft’s Call Routing Flow API, the solution maps how inbound calls are distributed, answered, or transferred within Teams, from customer-facing lines to internal routing.
This allows IT and operations teams to analyze queue performance, detect misconfigurations, and optimize call handling across departments or regions.
End-to-End Visibility Through Correlated Microsoft Data
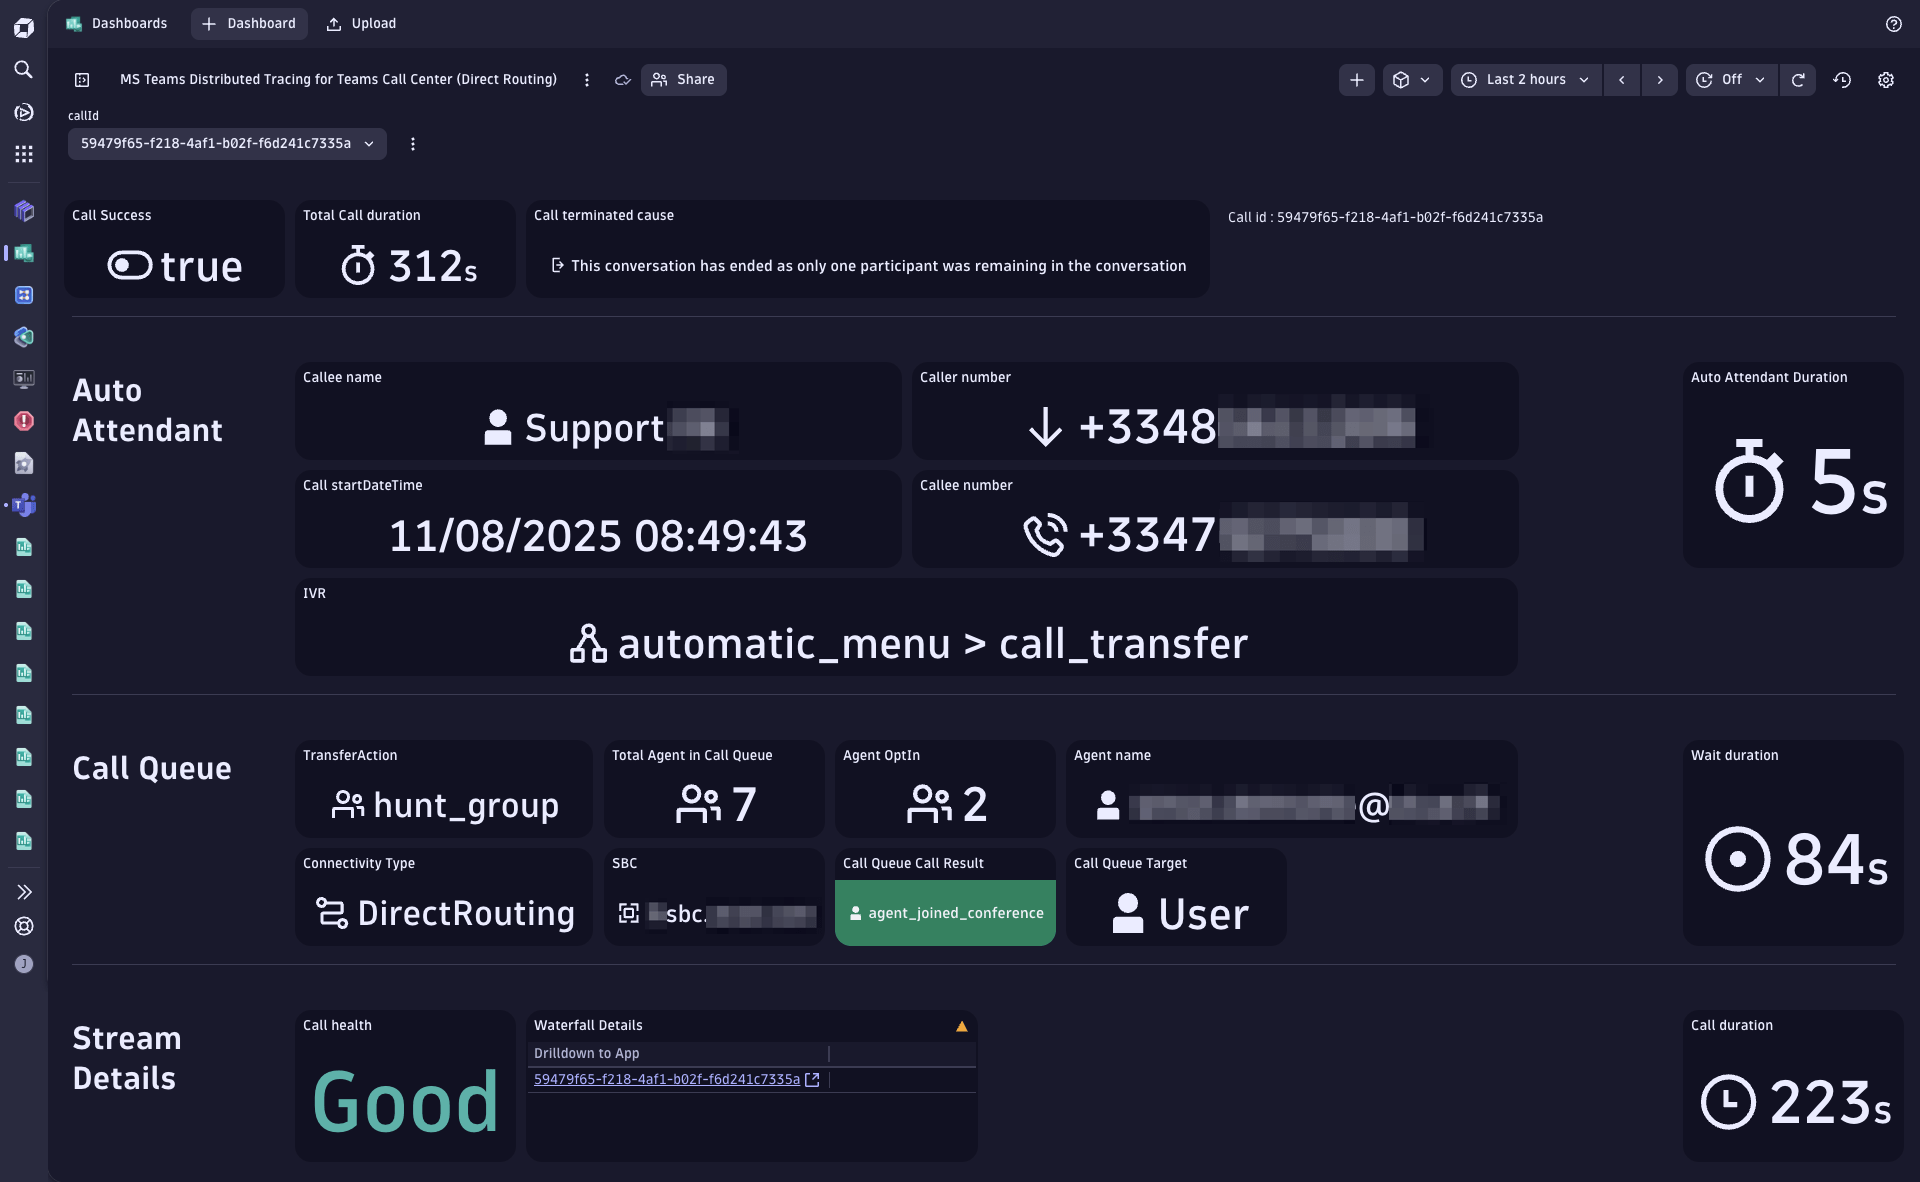
Thanks to its ability to correlate multiple Microsoft data sources using a unique Correlation ID, Phenisys delivers true end-to-end visibility.
From Direct Routing and PSTN Logs to Call Records, every data point is stitched together to form a complete picture of the call journey – across users, devices, sites, and Microsoft infrastructure.
This correlation eliminates blind spots and provides IT teams with a single source of truth for Teams Telephony performance.

Phenisys’ app correlates all data streams using Microsoft’s Correlation ID, providing a unified and traceable view of each call, from endpoint to cloud.
Tech Focus: The Power of Correlation ID
Each Teams call generates a unique Correlation ID.
Phenisys leverages this identifier to automatically link telemetry from multiple Microsoft data sources, including PSTN Logs, Direct Routing, and Call Records.
This enables true end-to-end observability, empowering IT teams to diagnose issues with full context and confidence.
From Metrics to Metrology : Phenisys’ Observability Advantage
Unlike traditional DEX tools (Aternity, Nexthink…) or Microsoft’s own dashboards, Phenisys goes beyond metrics collection.
It transforms Teams Telephony data into contextual observability, allowing teams to:
- Measure call performance in near real time,
- Visualize quality metrics on maps and waterfall timelines,
- Detect Microsoft service degradations impacting your tenant,
- Drill down into network KPIs per site,
- and identify root causes automatically with AI-ready workflows.
All within your existing Dynatrace or Splunk environment no third-party agent, no data silos, full security.
Built for Enterprises, Engineered by Experts
Phenisys is not just another monitoring vendor, it’s a pure observability player, certified partner and Dynatrace App Competition 2024 Winner.
With proven expertise across complex environments, Phenisys ensures that Teams Telephony performance becomes transparent, measurable, and manageable from the first hop to the last.
Its scalable licensing model adapts to any organization size, from fast-growing startups to global enterprises, based on active Teams users over the last 30 days.

The Future of Teams Telephony Troubleshooting
With this new Telephony Metrology experience, Phenisys redefines how enterprises monitor and manage their Teams voice infrastructure.
By combining API-based data collection, cross-source correlation, and intuitive dashboards, it turns every Teams call into an opportunity to learn, improve, and optimize.
No more guesswork. No more blind spots.
Just clear, actionable visibility, exactly when and where IT teams need it.


