Call Center Monitoring for Microsoft Teams: essential use cases to understand and improve your calls
A practical guide to clarify usage, balance call flows, and diagnose Teams calls.

A practical guide to clarify usage, balance call flows, and diagnose Teams calls.
Microsoft Teams has become a cornerstone of moderncall centers: flexible, fully integrated with Microsoft 365, and easy to deploy at scale. But once the environment is live, a recurring challenge emerges:operational visibility.
Why do some agents receive far more calls than others? Where do call abandons come from? Why does a queue become saturated on certain days? And above all: how can we explain variations in call quality depending on the site, the time of day, or the user?
To answer these questions, Microsoft Teams call center monitoring must be structured around four essential use cases:
Tracking agent usage and activity
Understanding Call Queue & Auto Attendant flows
Diagnosing calls end-to-end
Monitoring sites and subnets to stabilize call quality
These use cases form the foundation of effective operational control.
Tracking usage: understanding the real activity of your agents
In a call center, everything starts with understandingdaily usage: how many calls are processed, by whom, when, and from which sites.
Usage monitoring makes it possible to visualize:
call volume per agent
activity variations by time of day
distribution by team or queue
oversolicited agents
underutilized agents
global or local activity trends
These insights help rebalance workloads, anticipate peaks, and align staffing with actual demand.
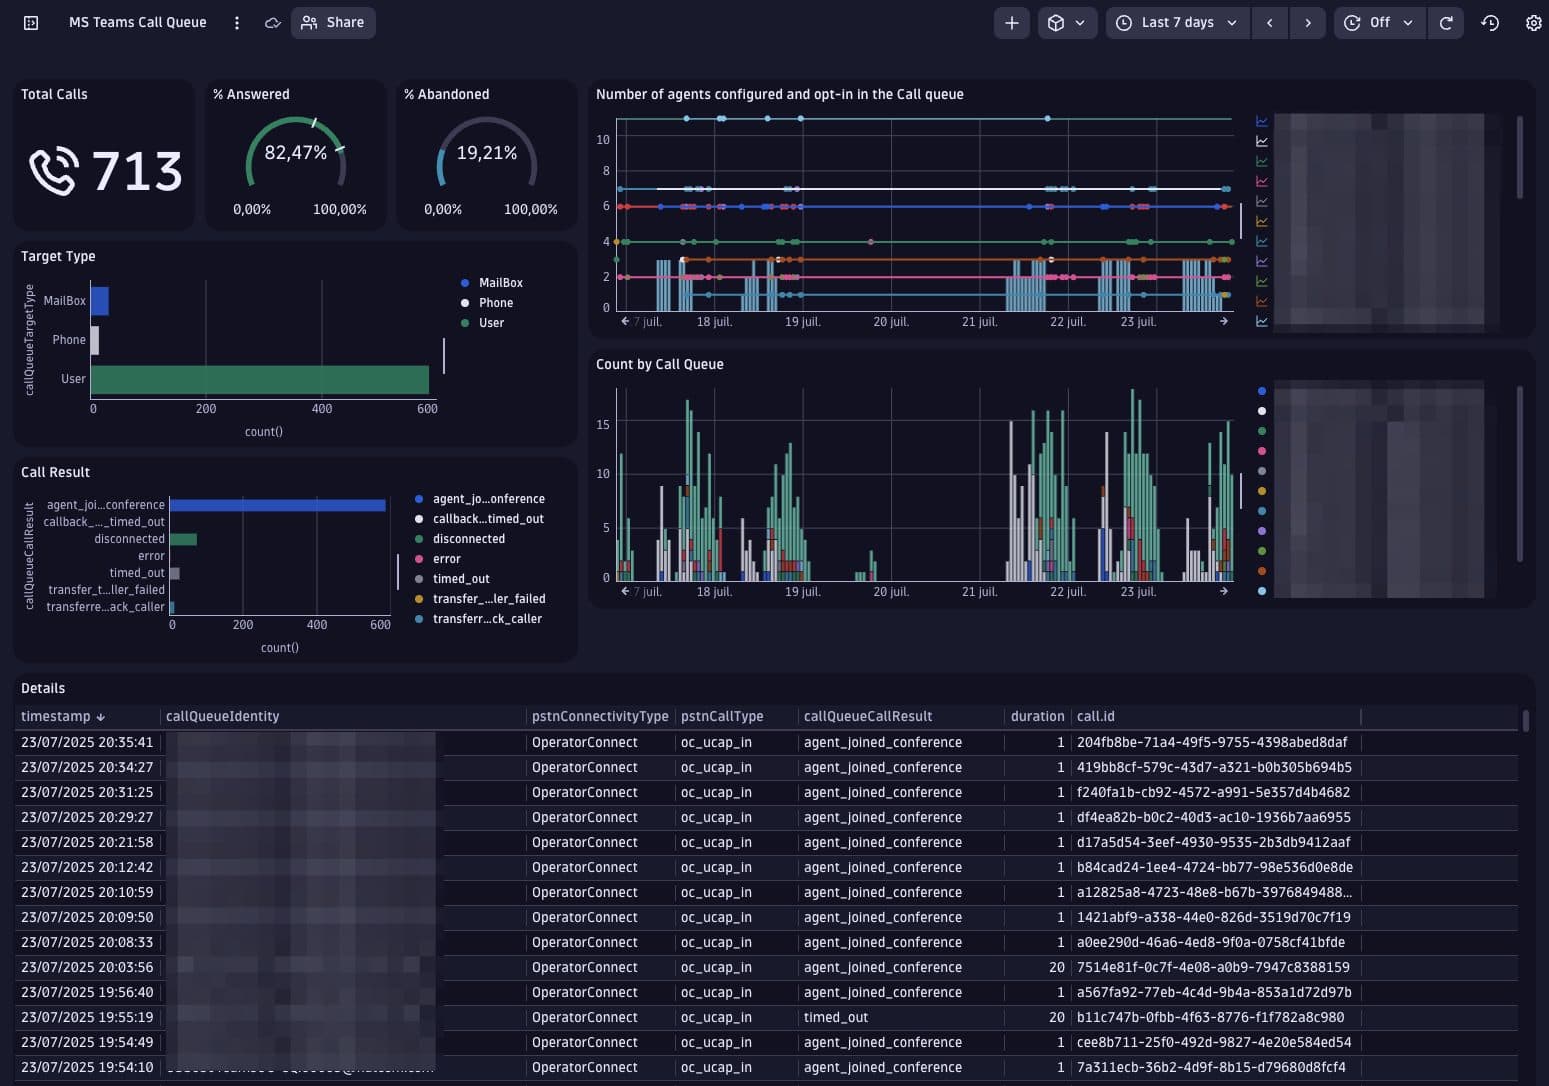
Some Teams observability solutions —includingMS Teams Observability by Phenisys— provide consolidated dashboards that surface this activity in seconds.
Understanding flows: analyzing Call Queues and Auto Attendants
Once usage is clear, the next challenge is understandinghow calls actually flowthrough Microsoft Teams.
Every Teams-basedcall centerrelies on two core components:
Auto Attendants (AA):call menus
Call Queues (CQ):waiting queues leading to agents
An incoming call typically follows a sequence like this:
These flows shape the service experience: routing logic, queue fluidity, agent availability, waiting times, and abandonment rates.
To operate a Teams call center effectively, it is essential to track:
the most frequently selected Auto Attendant options
the busiest queues
priority rules
call abandons
average waiting times
number of connected agents
transfers between queues
overload periods
A clear visualization of these flows helps identify bottlenecks and adjust call distribution efficiently.
This is what some Teams observability solution — including the solution developed by Phenisys — are designed to provide.
Diagnosing calls: analyzing full end-to-end quality
Next comes the question IT and Telephony teams encounter most often:How do we explain poor Teams call quality?
Diagnosis requires consolidating all relevant data points around the call.
Participant View: everything needed to understand an agent’s call
A modern diagnostic view brings together:
IP address and subnet
originating site
media protocol (UDP/TCP)
reflexive IP (critical for remote agents)
inbound/outbound network conditions
connection type (LAN, Wi-Fi, VPN…)
device and OS
These insights help isolate the root cause:
unstable Wi-Fi
high-latency site
packet loss on a subnet
TCP fallback
degraded remote connection
The network metrics that truly impact Teams call quality
The most decisive factors are:
latency,
jitter,
packet loss.
Comparing these metrics across sites or subnets makes it easy to spot issues:
This enables teams to quickly identify:
degraded sites
problematic subnets
unstable regional links
routing anomalies
Advanced diagnostics: reconstructing the entire call (distributed trace)
WithMS Teams Observability by Phenisys, you can go further by reconstructing the call using theCorrelation ID, producing a full “distributed trace”:
each participant,
each media stream,
each metric,
each network transition.
This is the most effective way to understand complex degradations.
Monitoring sites: stabilizing quality across your entire call center operation
Teams call centers rarely operate from a single building. Most aremulti-site, sometimesmulti-country, with hybrid or remote agents.
Multi-site monitoring helps you understand:
which sites are healthy
which sites show degradation
which subnets require attention
how local conditions impact calls
Here is an example of a useful geographic view:
This type of map helps identify:
high-latency regions
structurally weak buildings
unstable carrier links
priority sites for remediation
Phenisys’ solution also providessite complianceindicators to quickly assess the overall health of each location.
This matters because call quality issues in Teams arerarely global— they are almost alwaysgeographical.
Conclusion: a Microsoft Teams call center becomes manageable through four pillars
Monitoring a Microsoft Teams call center isn’t about collecting random metrics. It’s about connecting four essential dimensions:
real agent usage
AA/CQ routing flows
end-to-end call diagnostics
site and subnet performance
This unified understanding makes it possible to interpret imbalances, optimize call distribution, reduce abandons, and improve perceived call quality for both agents and customers.
When these four use cases come together, Teams call centers gain clarity, operational efficiency, and the ability to anticipate issues rather than react to them.
FAQ – Microsoft Teams Call Center Monitoring
How can I track agent activity in a Teams call center?
By monitoring call volume, peak hours, and distribution across teams or sites — the foundation of effectiveTeams Call Center Monitoring.
How can I understand Call Queue and Auto Attendant flows?
By visualizing call paths: priorities, abandons, overloads, and agent availability — key forTeams Telephony monitoring.
Which metrics explain Teams call quality?
Latency, jitter, packet loss, and media protocol. These are central toTeams call quality diagnostics.
How do I analyze a Teams call end-to-end?
By correlating data via a Correlation ID (distributed trace), as offered by some Teams observability solutions — including Phenisys.
How can I detect sites that degrade Teams call quality?
Throughmulti-site Teams monitoring: site-level KPIs and performance maps highlight problematic locations instantly.
Other articles
All resources
Observability at scale: from scoping to team self-sufficiency
From scoping to continuous improvement in operations, field experience on deploying observability and helping teams become self-sufficient.
ReadDiagnose Microsoft Teams incidents in minutes: try MS Teams Observability in Dynatrace (Demo mode)
Microsoft Teams has become a mission-critical tool for enterprises. Strategic meetings, day-to-day collaboration, telephony, contact centers, when Teams performance degrades, the impact is immediate for end users and for IT teams. The issue is not a lack of data.
Read
New in Teams Telephony: near real-time call metrology with Microsoft Teams Observability by Phenisys
Microsoft Teams has become the backbone of enterprise communication – for meetings, collaboration, and now full-fledged corporate telephony. But when it comes to call quality, performance metrics, and troubleshooting, most organizations still face the same problem: no clear visibility. That’s exactly what Phenisys is solving with the latest update to Microsoft Teams Observability – introducing […]
Read